For retailers, procurers & policy makers
EPREL data, built for professional decisions.
Search, compare, and analyse official EPREL product data — enriched with price and availability data — for documentation, public procurement, and market monitoring.
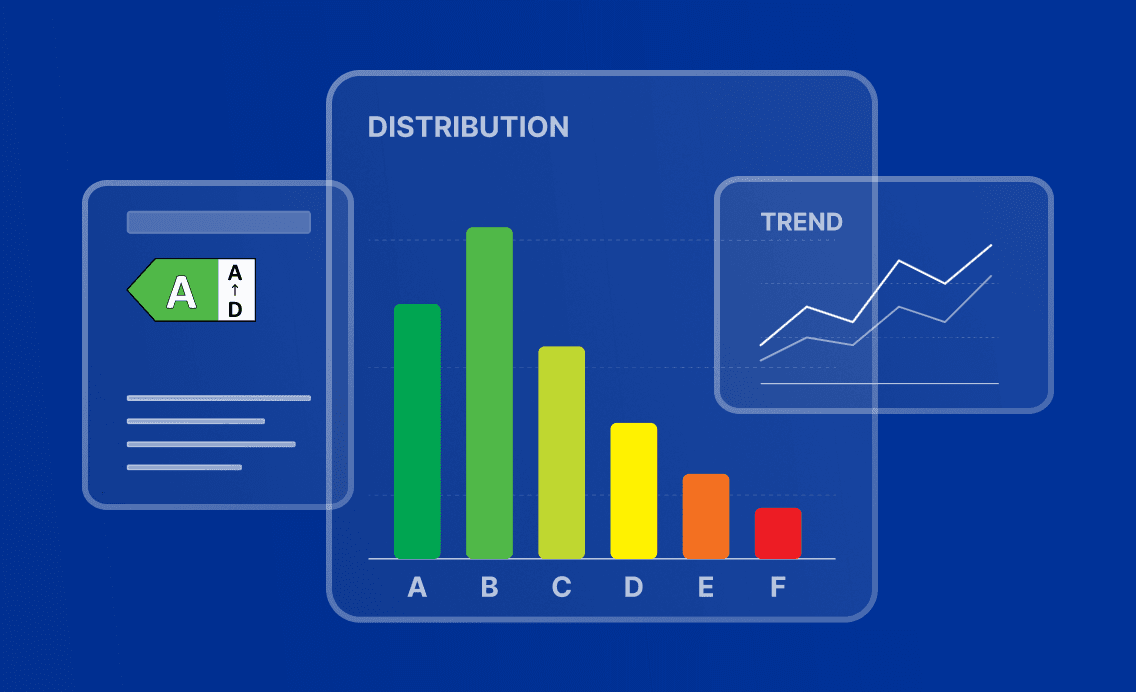
- Source
- EPREL
- Official registry
- Market availability
- 5.4M · 10 markets
- All product groups
- Freshness
- Daily sync
- Last updated: October 21, 2026
- Export
- CSV · XLSX · PDF · API
- With filter state
For policy makers
Monitor how the market is evolving across products, classes, and partner countries — and export the underlying data.
- Track trends over time per product group, class, and country.
- Compare any partner country against all available countries.
- Toggle between all products and only newly arrived products.
- Export results, charts, and underlying datasets with timestamps and scope preserved.
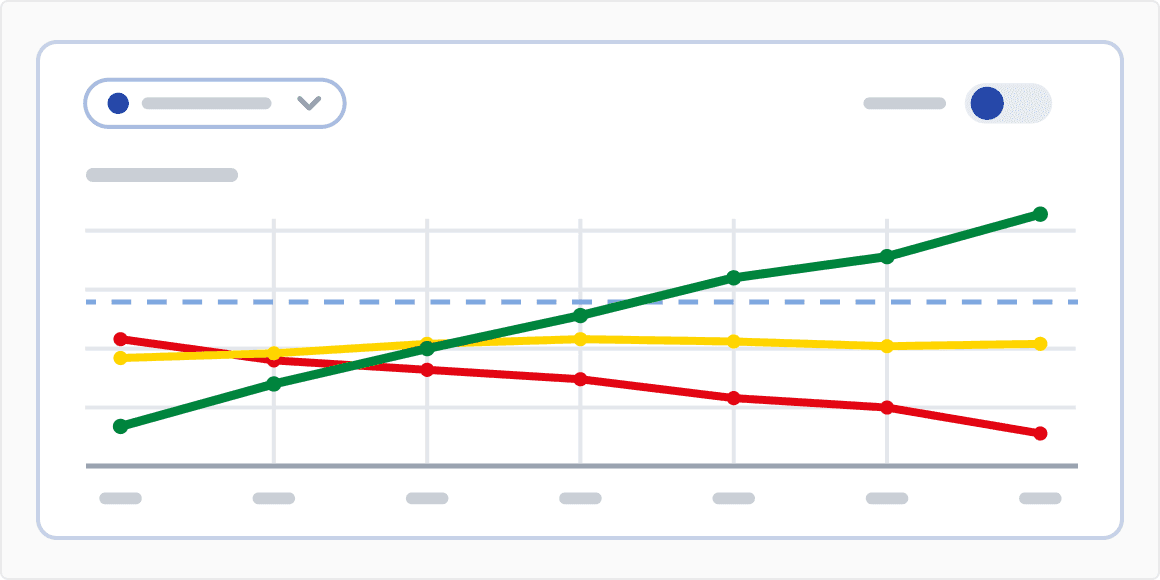
How market monitoring works on this platform
From data to insight in three steps.
- 01
Pick a country and group
Any partner country and any of the EPREL groups.
- 02
Track the data
Class distribution, parameter trends, country comparisons — all from one workspace.
- 03
Export the findings
CSV, XLSX or PDF results, charts, and datasets, with timestamp and scope preserved for reporting.
- Go to Market Analysis

Pick a country or all available markets
Country selector covers partner countries; combine all available data across markets.
- Go to Market Analysis
Pick a product group
Same group taxonomy as the rest of the platform.
- Go to Market Analysis
See class distribution
Energy class share at country level and across available markets.
- Go to Market Analysis
Distribution analysis per parameter
Statistical summaries and parameter histograms.
- Go to Market Analysis
Trends over time
Per-parameter and per-class evolution by month, quarter, semester, or year, at country level and across available markets.
- Go to Market Analysis
Check and compare new products on the market
Toggle between all products available on the market in the period and only products newly arrived in that period.
- Go to Market Analysis
Compare a country to cross-market averages
Side-by-side country vs. cross-market view.
- Go to Market Analysis
Export results, charts, and datasets
Excel datasets and chart images, with timestamp and scope preserved.
Frequently Asked Questions (FAQ)
Yes. Product data is available programmatically for read access, which is useful for retailers integrating product information into e-commerce systems. The cost calculator is also available as an embeddable widget for third-party sites, with no authentication required. Documentation links are available in the About section.
Product information comes directly from EPREL, the European Commission's official registry for energy-labelled products. The platform combines this information with additional market data, such as price and availability. Prices and availability may change over time and are provided for information purposes only.
Yes, exports show the data, the date of retrieval and the filters applied. This helps document how products were identified, compared or selected as part of a procurement process.
The product registry is synced with EPREL daily — see the "Last updated" date in the page footer. Prices and availability come from market data that is refreshed less frequently (roughly every two weeks) and are indicative only.